SUPER DATAMIX 5
Details Product
Super Datamix
SUPER DATAMIX
- Main menu
- Components of the recipes
- Recipes programming
- Groups for the loading
- Wagon program
- Loading operation record
- Unloads archive
- Operations costs
- Components stock
- Components supplies
- Personal customers data
- Wagon's composition
- Sending-Receipt of the data
- Configuration options of the program
- Utility for the maintenance
- Prints (Reports)
- Backup manager
Loading operation record

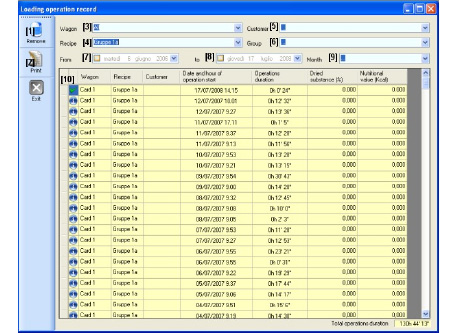
In this menu it is possible to visualize and keep under control the loading operations.
In the table [10] they are visualized the loading operations registered by the scale. On these it is possible to make some aimed researches to visualize the data you are interested in.
To make said researches it is enough to select from the menus, located in the upper part of the menu, the criteria in accordance to which data are required to be visualized. After that they will be only visualized the data matching the selected criteria research.
Above all it is possible to make researches on following subjects:
– Wagon [3]: in this list they are stated the wagons connected with the effected loading operations;
– Customer [5]: in this list they are registered all customers related to loading operations;
– Recipe [4]: in this list they are mentioned all the recipes connected with the loading operations;
– Group [6]: in this list they are stated all the groups related to the loading operations;
– From [7]: from this calendar it is possible to select the date of the beginning of the operations to be visualized (when entering the first time, the starting date is automatically corresponding with the older date of the loading operations) up to the date mentioned in the section [8]
– To [8]: from this calendar it is possible to select the date of the end of the operations to be visualized (when entering the first time in this menu, the ending date is automatically corresponding to the most recent date of the loading operations) and to be combined with the starting date selected in the section [7]
– Month [9]: in this list it is possible to select the month of the operations to be visualized.
To visualize and eventually print the reports, it is necessary to select one or more lines in the table and press “Print” [2].
