SUPER DATAMIX 5
Details Product
Super Datamix
SUPER DATAMIX
- Main menu
- Components of the recipes
- Recipes programming
- Groups for the loading
- Wagon program
- Loading operation record
- Unloads archive
- Operations costs
- Components stock
- Components supplies
- Personal customers data
- Wagon's composition
- Sending-Receipt of the data
- Configuration options of the program
- Utility for the maintenance
- Prints (Reports)
- Backup manager
Operations costs

In this menu it is possible to visualize and keep under control the production costs making the distinction between the milk cost and the operations cost.
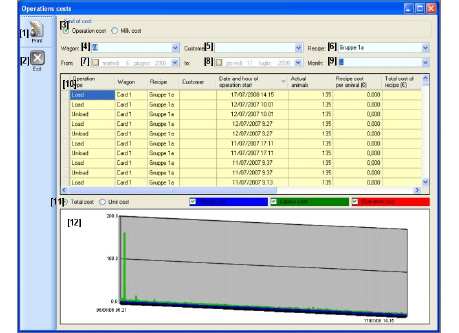
In the table [10] they are visualized the loading and the unloading operations registered by the scale. On these it is possible to effect some aimed researches to visualize the data you are interested in.
To make said researches it is enough to select from the menus, located in the upper part of the menu, the criteria in accordance to which data are required to be visualized. After that they will be only visualized the data matching the selected research criteria.
In particular it is possible to make researches on following objects:
– Wagon [4]: in this list they are registered all the wagons existing in the loading and unloading operations;
– Customer [5]: in this list they are registered all the customers existing in the loading and unloading operations;
– Recipe [6]: in this list they are registered all the recipes existing in the loading and unloading operations;
– From [7]: from this calendar it is possible to select the date of the beginning of the operations to be visualized (when entering the first time, the starting date is automatically corresponding with the older date of the loading and unloading operations)
– To [8]: from this calendar it is possible to select the date of the end of the operations to be visualized (when entering the first time in this menu, the ending date is automatically corresponding to the most recent date of the loading and the unloading operations)
– Month [9]: in this list it is possible to select the month of the operations to be visualized.
It is furthermore possible to decide and choice if the costs related to the operations (loads and unloads) or concerning the milk production have to be visualized by selecting the relevant option [3].
For the visualized operations it is also available a graphic [12] in which they are evidenced the cost of the recipe (in blue color), the cost of the labor (in green) and the cost of the operation (in red).
Moreover, it is also possible to decide to visualize only some data in the graphic and if you want to visualize the total cost or the unit one (namely the cost per animal in case of operation cost or the cost per liter in case we are talking about costs of the milk): this is possible by selecting them or not in the relevant selectors [11]
If you want to visualize and eventually print the Reports, it is necessary to select one or more lines in the table and then press “Print” [1].
